Diagnosing Thread Pool Starvation in ASP.NET Core
After over a decade working alongside technology leaders at some of the world’s largest enterprises, I’ve seen how thread pool starvation in ASP.NET Core quickly escalates from a quiet performance hiccup to a full-scale business incident. You may notice symptoms first—a queue of requests forming, fluctuating response times—while system dashboards show "green." The deeper cause is rarely obvious at first glance and, more often than not, drives urgency into both engineering and executive ranks as customer expectations and regulatory frameworks tighten. This post distills lessons from global-scale outages, practical diagnostics refined in high-pressure war rooms, and the leadership choices hidden behind every risky async migration. Expect hands-on examples, cross-team context, and a candid discussion: unraveling threading issues isn’t simply about clean code, but also calls for operational discipline and shared ownership from the boardroom down.
Key Takeaways
- Thread pool starvation leads to sluggish APIs and is triggered by insufficient worker threads handling queued requests.
- Synchronous blocking code, especially with .Result, .Wait(), and slow I/O, is the top culprit in ASP.NET Core applications.
- Practical diagnostics require tooling like dotnet-counters, dotnet-trace, and Visual Studio’s performance profiler.
- Monitoring thread pool metrics, such as worker thread count and queue length, helps distinguish between app code and resource issues.
- Refactoring APIs with async/await prevents blocking and improves throughput—if dependencies and organizational habits allow this.
- Production teams often discover unexpected sources of blocking, from third-party libraries to legacy database drivers.
- Consistent logging, proactive monitoring, and post-incident reviews turn starvation lessons into lasting operational resilience.
The Thread Pool: ASP.NET Core’s Silent Workhorse
Within .NET applications, the thread pool functions as a kind of traffic controller—routing background operations, handling HTTP calls, and serving timer-based jobs. Rather than spawning a new thread for each task (an expensive operation), the runtime juggles a managed pool, scaling supply with demand but always enforcing system boundaries to ensure stability.
When everything runs smoothly, it's a model of efficient concurrency. However, things veer off-course if critical threads are blocked: requests start stacking up, and your application’s throughput collapses. IT teams might see healthy hardware readings while business owners experience customer-facing slowdowns. I recall an enterprise retail system last winter, where post-event analysis found monitoring tools flagged “green,” missing the subtler signals of a thread pool exhausted by blocking calls. Weeks of blame-shifting between network, infrastructure, and software teams ended once thread-level data revealed the true resource bottleneck.
Decoding Thread Pool Starvation in Enterprise APIs
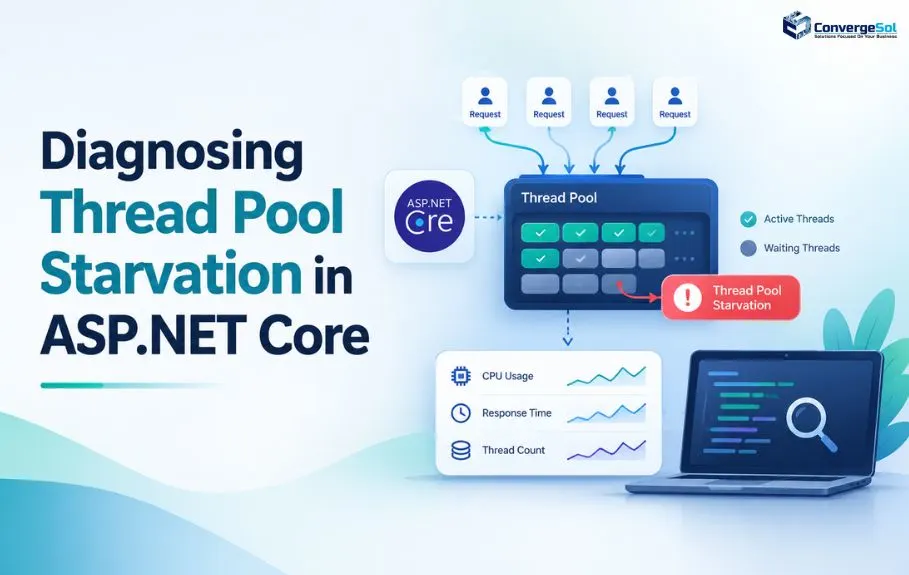
Thread pool starvation happens when too many threads are blocked—typically due to synchronous waits deep inside application code—leaving new requests stranded. Imagine a busy help desk with all agents stuck on calls to the same problematic vendor; new customers pile up, but nobody answers.
Consider a case from a global insurer: after extensive load balancing tweaks, customer-facing APIs still underperformed during high traffic. Investigations eventually traced the cause to a legacy reporting subroutine, where a critical path called .Result on an async I/O operation. Throughout peak load, precious thread pool workers sat waiting, preventing core transactions from completing. The team had ample knowledge of scaling and modern architecture, but gaps in exposing thread-level health meant resolution was delayed—and contract SLAs were breached before true alignment was found.
Where Code—and Assumptions—Run Into Trouble
Despite mature engineering organizations, thread starvation persists—frequently the byproduct of innocuous shortcuts or deeply embedded legacy practices. Notable real-world failure patterns include:
- Synchronous choke points: Seemingly harmless uses of
.Resultor.Wait()on async methods, often buried in utility classes, can cripple throughput under pressure. Even teams who refactor service layers can overlook such calls in shared libraries, leading to cascading delays. - Heavyweight I/O on pool threads: When file or database actions remain synchronous, or external drivers lack proper async support, pool threads lock up. An anonymized example: during a retail holiday spike, one blocking disk export halted dozens of threads, creating a logjam on checkout endpoints until IT intervened.
- Synchronously-wrapped integrations: Modern SaaS connections, such as payment APIs, cause widespread slowdown when wrapped inside blocking middleware layers. During major launches, this effect magnifies, as hundreds of requests await replies in lockstep.
- Manual thread pool misconfiguration: Enterprises sometimes restrict thread pool size to control noisy neighbors on shared infrastructure. But when traffic spikes unexpectedly (think compliance reporting cutoffs or sales events), systems stall with little warning.
- Opaque third-party dependencies: Libraries with hidden blocking operations often remain undetected until a crisis. Auditing or asking tough questions of black-box vendors typically only happens post-mortem.
These scenarios aren’t theory—they echo in organizations implementing enterprise AI integrations, where async assumptions break when model initialization routines slip in a synchronous hold. These are costly mistakes and highlight why robust code review and dependency audits are not negotiable.
Seeing the Signals: How Starvation Emerges in Production
In day-to-day operations, starvation rarely introduces itself politely. Leaders experience it as missed SLAs, increased escalation, intermittent slowdowns without a clear cause, and frustrated customers. Behind the scenes, support and IT teams may chase symptoms—CPU and memory appear stable, while queues quietly grow.
A fintech firm in the U.S. encountered this after launching an investment tool that unexpectedly drew thousands of simultaneous users. Half the request pipeline timed out, with tickets escalating as transaction data lagged. The technical analysis traced the pattern to a blocking ORM call in a hot route, discovered only after deep log correlation. The cost? Missed revenue and a multi-week atmosphere of finger-pointing across engineering, ops, and customer care—plus a loss of executive confidence and an expensive, expedited refactor project.
Diagnostics That Uncover the True Problem
Thread pool starvation evades many common cloud and infrastructure dashboards. To find it, you need targeted, layered instrumentation:
- dotnet-counters: Captures live stats, including thread pool size and queue depth. Persistent high queue lengths or fully engaged workers while request throughput lags is a major red flag.
- dotnet-trace: Enables forensic trace recording, revealing spikes in queued requests and thread states, often with CPU underutilized.
- Visual Studio Diagnostic Tools: Ideal for profiling thread behavior and surfacing blocking call stacks in test and staging. Helps short-circuit blockers before they ever reach production.
- Structured logging routines: Beyond timing endpoints, log thread pool status at strategic points within API flows. Over time, this contextual insight becomes critical during escalations or audits.
Leaders sometimes misread provider dashboards—these tools may not highlight thread-level stalls if reporting is scoped to VM, container, or process-level stats. For regulated environments or where API observability doubles as a security investment, cross-referencing with your API security and observability protocols is essential. For example, during a DDoS scenario or malicious input spike, symptoms can mirror starvation—yet resolving them demands entirely different playbooks.
Fixing Patterns: Async Migrations in the Real World
Take a snippet from a major healthcare client’s codebase reviewed during scaling stress tests:
var result = _recordsService.LoadPatientDataAsync().Result;
At face value, the logic is clear—wait for a result before proceeding. Yet each instance ties up a pool thread, and under burst conditions, requests backlog or timeout. Once this pattern was replaced with:
var result = await _recordsService.LoadPatientDataAsync();
performance measurably improved. However, this apparent silver bullet comes with its own obstacles:
- Dependencies not truly async. If the underlying services—databases, external systems—remain synchronous, async at the API layer yields only marginal benefit. Executive stakeholders and architects must challenge vendor readouts and conduct in-depth contract or SLA reviews before committing to widespread rollout.
- Async requires organizational maturity. A team moving to async rapidly finds itself re-architecting error handling, undoing years of established patterns, and contending with both test coverage risk and cultural learning curves. Pushing these changes under tight deadlines frequently exposes regression risk or complicates parallel go-lives.
- Legacy code amplifies challenge. Sprawling codebases force tradeoffs: refactor aggressively and risk operational instability, or keep patching “known offenders” and accept chronic debt. CTOs and product owners must balance rollout timelines, regulatory deadlines, and the cost of failed refactors.
Patricia, CTO at a global SaaS provider, recounted to her leadership team: "Our decision to greenlight full async migration meant facing a temporary hit to delivery velocity and onboarding costs. But deferring action exposed us to repeated support incidents, vendor escalation, and risked non-compliance in regulated markets. The pain of refactor was finite; inaction threatened revenue stability."
When full async migration isn’t feasible (for instance, with fixed partner SLAs, integration deadlines, or budgeted regulatory windows), some organizations opt for targeted async wrappers, microservice isolation, or phased rollouts—accepting that partial mitigation comes with growing technical debt and potential compliance exposure. Executive alignment on these tradeoffs, grounded in real projected business impact, consistently distinguishes successful adaptation from endless firefights.
Organizational Headwinds and Strategic Choices
Struggles with thread pool exhaustion often reveal much deeper enterprise realities:
- Prioritization friction: Should the roadmap support two sprints of async refactoring, or push hardware scaling and traffic-shaping efforts for faster results? Technical debt is rarely “owned” equally—engineering teams flag risk while stakeholders may focus on more visible symptoms or cost centers.
- Patching vs. resilience building: The reflex to repeatedly add hardware capacity or manipulate thread limits rarely solves underlying inefficiency; real savings and SLA improvements come from tackling code debt directly, even when short-term path is more painful.
- Regulatory and compliance drag: Industries subject to tight reporting standards—such as financial services and public sector—face additional risk. Unplanned downtime or SLA breaches aren't just technical mishaps but can drive external audits or even legal exposure.
- Change resistance in culture: Legacy habits—especially in orgs with engineers trained pre-async era—can stall remediation efforts. Leaders must often supplement technical mandates with strategic communication and targeted, recurring training.
- Learning curve in escalating situations: The first time a team confronts starvation is rarely controlled—often discovered mid-incident by those who then must learn on the fly. Mature organizations build recurring knowledge transfer and explicit async code review into day-to-day workflow, so fire drills turn into institutional learning.
- External integration risk: Thread starvation isn’t always an inside job. Integrating with major SaaS (like Salesforce) or downstream analytics partners can introduce blocking patterns that propagate across organizational boundaries.
High-performing enterprises stand out by pairing detailed thread pool monitoring with application-wide observability platforms, continually feeding learnings back into developer playbooks and onboarding. When teams openly debrief async-related incidents, the shift from reactive firefighting to proactive resilience accelerates.
Modernizing ASP.NET Core for Thread Pool Health
Technical best practices are necessary—but sustainable defense demands sustained feedback, upfront investment, and cross-team trust:
- Replace blocking waits wherever found—even the most carefully architected systems accumulate overlooked
.Resultand.Wait()calls. Build regular code search and review around this. - Bake async profiling into the lifecycle—integrate static analysis and async compliance checks into PR workflows, well before changes hit production.
- Deep-dive dependency audits—verify all major libraries and integrations offer real async implementations, and flag issues with vendors proactively when they arise—don't wait for an incident.
- Real-time thread pool dashboards—establish automated alerts for queue growth or thread exhaustion; treat these as first-class operational signals, not engineering afterthoughts.
- Set async criteria for code reviews—make async/await adoption an explicit review standard, tying readiness to business objectives and customer impact.
- Convert post-incident reviews into living playbooks—use past problems to inform future onboarding, incident response, and risk assessment efforts.
For highly regulated sectors, tracking thread health forms part of audit readiness and is directly referenced in compliance programs. When integrating with cloud, SaaS, or analytics partners, coordinated code review between teams prevents unseen blocking dependencies from crossing organizational lines and undermining SLAs.
When budgeting technical debt or justifying operational investments, ground your business case in relatable metrics: how a few hundred milliseconds in API latency might lose percentage points in online conversion, extend audit clearing cycles, or drive up customer churn. When uncertainty abounds, anchoring architectural risk in real, quantifiable business loss focuses exec conversations and speeds decision-making.
For further breakdowns and field-tested methods in resilient new product launches, review case-driven SaaS company approaches.
Frequently Asked Questions
What is thread pool starvation in ASP.NET Core?
Thread pool starvation surfaces when every worker thread is busy—typically stalled by blocking calls—so queued requests have nowhere to run. The ripple effects in ASP.NET Core include timeouts, frustration for customers, and mounting operational overhead during incident response.
How Do You Detect Thread Pool Starvation in ASP.NET Core?
You’ll often observe increasing request latency, accompanied by flat CPU and low memory utilization. If you’re monitoring thread queues (via dotnet-counters or dotnet-trace), a steady or spiking queue size with no improvement in throughput is a reliable indicator. Engineering teams frequently catch it only after extended log review and process-of-elimination investigations.
What Causes Thread Pool Starvation in ASP.NET Core APIs?
Most incidents arise from a combination of synchronous waits within “async” code paths, external service calls executed without async support, and overlooked blocking I/O in dependencies or partner APIs. The root cause often surprises teams who assumed modern frameworks eliminated these risks.
How Do You Fix Thread Pool Starvation in ASP.NET Core?
The most effective path is widespread adoption of async/await—including vendor and partner layers—combined with vigilant dependency auditing and ongoing monitoring for pool bottlenecks. Pair technical improvement with team learning and concrete code review standards to embed these changes into workflow.
Can Thread Pool Starvation Occur in Low-Traffic ASP.NET Core Applications?
Not at all. Even low-traffic environments can experience starvation if just a handful of endpoints block worker threads—especially in complex or heavily integrated enterprises, where edge cases and unexpected spikes uncover technical debt hidden in everyday workflows.
Diagnosing thread pool starvation in ASP.NET Core is a multilayered challenge for enterprise leaders intent on minimizing customer churn, contractual risk, and operational budget overruns tied to latency. The most durable outcomes emerge not from quick technical fixes alone, but from sustained investments in team upskilling, incident transparency, and the willingness to treat thread pool health as a cross-functional priority spanning architecture, compliance, and vendor management.
Delaying async adoption or comprehensive refactoring often postpones, rather than prevents, reputation loss, unplanned costs, or SLA breaches. For executives weighing options, pilot targeted diagnostics—preferably on the most critical revenue paths—combine findings with business impact analysis, and secure cross-functional alignment on both short-term mitigations and longer-term migration. Where full async isn’t immediately feasible, require explicit plans for debt management, vendor negotiation, and gradual upskilling, keeping audit and compliance needs front of mind.
Want deeper technical strategy and peer-tested frameworks? Explore .NET 10’s pragmatic enhancements for scalable systems, or see how teams implement AI-driven monitoring to keep performance surprises from becoming costly incidents.
Based in the US and evaluating a software development partner?
Connect with our team to discuss your technology needs and explore how we can help. Talk to our team
Write your comment
Recent Blogs