100 Database Queries vs 1 Query: Measuring the N+1 Problem in EF Core
If you’ve been involved in enough high-stakes software reviews, you’ve probably seen the N+1 query problem come up when an application suddenly develops a performance bottleneck.
It’s easy to dismiss N+1 as a developer mistake. In practice, it is often much bigger than that. It can grow out of tight delivery timelines, shortcuts made during feature development, assumptions about data volume, or simply code that behaves perfectly with test data but struggles when real customers and real workloads arrive.
I’ve seen financial compliance platforms slow down during regulatory reporting periods and healthcare portals struggle when data access increased unexpectedly. In both cases, what looked like “just another database query” during development became a much larger operational problem in production.
That is what makes N+1 particularly dangerous. The application may look fine before launch. Then data grows, concurrency increases, and suddenly response times climb, cloud database costs increase, SLAs are at risk, and leadership is asking why the architecture did not account for scale.
This article looks at how N+1 query problems develop in EF Core, how to measure them, how to choose the right fix, and how engineering and leadership teams can prevent them from becoming production incidents.
For organizations building or modernizing enterprise applications, this also makes performance part of the product architecture. ConvergeSol’s Product Development Solutions help businesses build scalable and maintainable software with long-term performance in mind.
Key Takeaways
- N+1 is more than a code-level performance issue. In enterprise applications, excessive database calls can increase latency, cloud costs, SLA risk, support volume, and compliance exposure.
- Functional testing does not guarantee efficient database behavior. An EF Core query can work perfectly with small test datasets and still generate hundreds or thousands of database calls at production scale.
- Measure the actual SQL behavior. EF Core SQL logging, query counters, profiling, and automated query-count thresholds can reveal problems that are difficult to spot from C# code alone.
Include()is not always the best fix. Eager loading can eliminate unnecessary round trips, but projection with Select() may be more efficient when an application needs only specific fields.- Query optimization should follow the business requirement. The right approach depends on data shape, response-time targets, compliance requirements, maintainability, and operational risk.
- Production-scale testing matters. Realistic data volumes and concurrency are essential for identifying N+1 problems before they become production incidents.
- Prevention should be part of engineering governance. Query-count limits, SQL reviews, performance benchmarks, and incident feedback loops can make database efficiency a repeatable engineering practice.
- The goal is not simply fewer queries. The real objective is predictable performance, controlled infrastructure cost, appropriate data access, and enough architectural flexibility to support future business needs.
Recognizing How N+1 Patterns Creep Into Applications
N+1 problems often appear when an application starts aggregating larger amounts of data.
Think about grids, reports, dashboards, customer lists, or APIs that return a collection of parent records along with related information. A feature may initially work well with a few dozen records. As the dataset grows into hundreds or thousands, hidden database calls can become expensive very quickly.
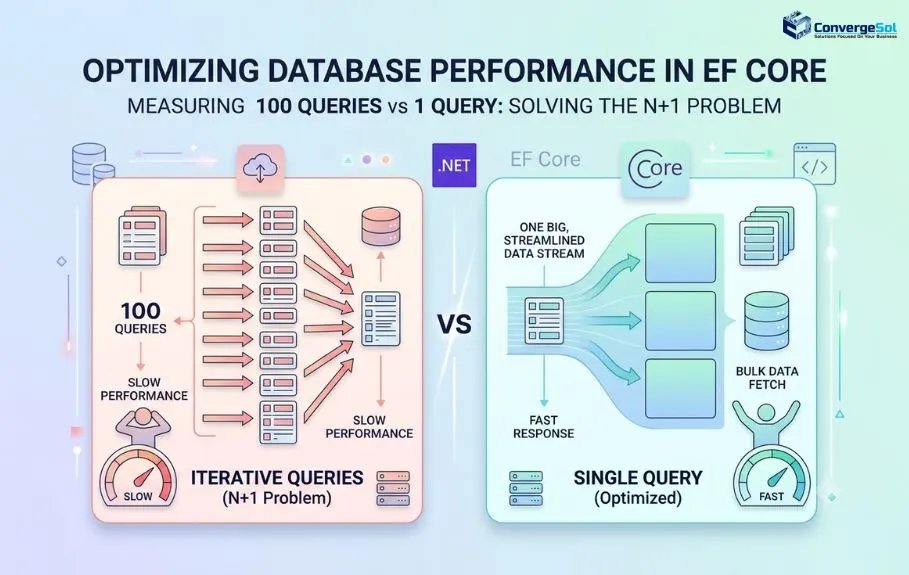
For example, consider an Invoice entity with a Customer navigation property. If related data is loaded individually, accessing Invoice. Customer for every invoice can result in a separate database call for each customer.
That means one query to retrieve the invoices becomes:
1 query for the invoices + N queries for the related customers = N+1 queries.
At one major insurer, a portfolio dashboard that was designed to make analysts more productive ended up generating more than 400 child lookups during a refresh. Each lookup added latency and eventually put regulatory reporting SLAs at risk.
The root cause was not obvious from the UI. The application simply appeared slow. It was only after the operations team reviewed the database query logs that they discovered navigation properties were quietly generating hundreds of additional requests.
This is one reason N+1 issues are easy to miss: the code can be functionally correct while the database behavior is completely wrong for the expected scale.
Sales forecasting platforms, issue-tracking systems, appointment schedulers, and other data-heavy applications can experience the same problem. Everything may pass functional testing, only to slow down once production data and concurrency enter the picture.
When that happens, the technical issue quickly becomes a business issue: delayed deliverables, missed SLOs, higher infrastructure costs, and urgent architecture reviews.
Why Navigation Properties and Lazy Loading Can Create Bad Surprises
EF Core makes it convenient to work with related data.
Navigation properties allow developers to move through an object graph naturally, which makes application code easier to read and faster to write. The problem is that this convenience can hide what is actually happening at the database level.
When teams are under pressure to deliver a customer-facing feature, it is tempting to rely on familiar navigation properties and lazy-loading behavior rather than explicitly thinking through the data access pattern.
Microsoft also documents the performance implications of lazy loading in its EF Core guidance on efficient querying, including how additional database round trips can contribute to N+1 behavior.
A global retailer experienced this with its loyalty platform. Customer list pages performed well with test accounts, but seasonal traffic exposed the problem. Each customer list operation triggered additional hidden queries through navigation properties. Response times eventually moved into double digits, while cloud database usage and costs climbed at the same time.
The important lesson is that the navigation property itself is not the problem. The problem is losing visibility into when and how much data the application is fetching.
When every accessed property can result in another database call, technical debt can build quietly. If feature delivery consistently moves faster than architecture review, the issue may remain invisible until a promotion, audit, reporting cycle, or customer surge exposes it.
At that point, IT finance may become involved, compliance teams may start asking questions, and product releases can be delayed while engineers trace the data-access path.
The Real Cost of N+1 in Live Scenarios
Small development datasets rarely tell the whole story.
One anonymized SaaS operation saw its daily database queries increase from roughly 800 to nearly 25,000 after activating a customer-data analytics module.
When database activity becomes a measurable business concern, broader data architecture and optimization also become important.
The cause was eventually traced to a single API designed to summarize order history. Instead of making one efficient database request, it was generating approximately 150 sub-queries per API call.
Initially, the interface still appeared responsive. As more customers came online, however, response times stretched into minutes. 90th-percentile latency increased, infrastructure costs climbed, and compliance monitoring began flagging unusual database activity.
This illustrates an important point: the impact of N+1 is not limited to milliseconds on a developer's laptop.
It can affect:
- API response times
- Database CPU and connection usage
- Cloud infrastructure costs
- SLA and SLO performance
- Customer experience
- Support volume
- Compliance and audit activity
- Renewal and revenue risk
A dashboard may show the database query spike within seconds. The business impact can continue long after that—through SLA credits, support escalations, missed deadlines, and even failed customer renewals.
That is why production-scale data and realistic concurrency need to be part of performance validation, especially for data-heavy enterprise applications.
Quantifying the N+1 Problem: Move Beyond Guesswork
You cannot reliably diagnose N+1 by looking at application code alone.
The application may feel slow, but that does not tell you whether the problem is database calls, CPU usage, network latency, locking, serialization, or something else.
The first step is to measure what EF Core is actually doing.
Teams can integrate EF Core SQL logging into QA and performance-testing workflows to capture:
- Total SQL round trips
- Repeated query patterns
- Queries generated by navigation properties
- Query counts per endpoint
- Query behavior before and after optimization
One North American lender took this a step further after experiencing two prolonged quarterly-reporting outages. The engineering team introduced a policy that no endpoint could trigger more than 10 SQL calls per business request.
Combined with regular query-log reviews, the policy helped the organization identify problematic data-access patterns before the next quarterly reporting period and reduce the risk of unexpected infrastructure costs and missed regulatory filings.
More mature environments can use automated query interceptors to capture and visualize query behavior by feature, endpoint, or team.
That changes the conversation considerably.
Instead of asking:
“Why is this endpoint slow?”
Leadership can ask:
“Which business workflow is generating the additional SQL calls, and who owns the remediation?”
That is a much more useful question because the problem becomes measurable, attributable, and actionable.
LINQ and the Transparency Problem: Why Simple C# Can Hide Complex SQL
LINQ is one of the reasons .NET development can be so productive.
A developer can express business logic in readable C#, but the resulting SQL may be considerably more complex than the original code suggests.
That gap can create problems during architecture reviews.
A developer may believe a particular operation represents one database call, while EF Core generates multiple SELECT statements. If nobody reviews the generated SQL or measures the actual round trips, the issue can remain hidden.
This can affect procurement systems, logistics platforms, HR applications, and customer self-service applications.
In one HR onboarding system, weeks of user complaints eventually led to an investigation that found 60 SQL queries were being executed just to assemble a candidate profile view. The individual property accesses looked harmless in the application code, but collectively they created a significant database workload.
A useful practice to take from situations like this is simple:
Pair important EF Core code changes with a review of the SQL they generate.
For data-heavy features, a code review should not stop at “Does the C# look correct?”
It should also ask:
- How many SQL statements does this produce?
- What data is being returned?
- Are we retrieving fields the application does not use?
- Does query behavior change with realistic data volume?
- Is the query count acceptable for the business operation?
For additional guidance on diagnosing related runtime performance problems, see our Diagnosing Thread Pool Starvation in ASP.NET Core APIs.
Addressing N+1 Strategically: Let the Business Requirement Guide the Technical Choice
There is no single N+1 fix that works for every application.
The right approach depends on the data shape, business requirement, performance target, maintainability needs, and operational constraints.
1. Eager Loading with Include()
Include() is often the first technique developers reach for.
It allows related entities to be loaded as part of the query rather than fetched individually later. In the right scenario, that can eliminate N+1 behavior and significantly reduce database round trips.
Microsoft provides additional guidance on eager loading related data in EF Core, including the use of Include() and ThenInclude().
However, Include() is not automatically the best solution.
Large or deeply nested object graphs can result in unnecessarily large result sets, additional joins, higher memory consumption, or more complex SQL.
The key question is not:
“Can we use Include()?”
It is:
“Is loading this entire related object graph actually what this business operation needs?”
2. Projection with Select()
Projection is often a better choice when an application only needs a small portion of the entity data.
For example, if a notification only needs Customer.Name, there may be little reason to load the complete Customer entity and all of its related data.
Using Select() allows the query to request only the fields required by the application.
This can reduce:
- Data transferred from the database
- Memory usage
- Network overhead
- Query complexity
- Accidental data exposure
In one ERP modernization effort, moving from broad entity loading to more targeted DTO projections reduced the data synchronization window by 60% and significantly reduced after-hours support tickets.
3. Explicit Loading
Explicit loading gives developers more direct control over when related data is retrieved.
It can be useful when the application needs highly targeted data access, particularly in permission-sensitive systems or architectures where data is partitioned across services.
The tradeoff is that explicit loading generally requires more deliberate code and can increase maintenance effort as requirements evolve.
In regulated environments, that additional control can be valuable because it helps teams make data-access decisions explicitly rather than relying on implicit behavior.
For a broader approach to enterprise data management, see our Data Solutions.
Choosing the Right Approach
| Approach | Benefits | Risks |
|---|---|---|
Eager Loading (Include()) |
Conveniently loads parent and related data; can reduce round trips | May retrieve unnecessary data, increase memory usage, and create complex joins |
| Projection (Select()) | Retrieves only required fields; reduces payload and bandwidth | Requires more deliberate query design and testing |
| Explicit Loading | Provides precise control over related-data retrieval | More verbose and potentially harder to maintain |
The best solution should ultimately be judged against measurable business outcomes such as response time, transaction cost, database utilization, data-access requirements, and audit traceability—not simply developer preference.
Practical N+1 Pitfalls: Lessons for Teams Learn the Hard Way
Enterprise teams rarely get EF Core performance patterns perfect from day one.
Some mistakes appear repeatedly:
- Assuming LINQ automatically results in a small number of SQL queries without reviewing the generated SQL.
- Chaining multiple
Include()calls without considering the actual shape of the data the business operation requires. - Disabling lazy loading globally but failing to investigate legacy code that still performs unexpected database access during exports or reporting.
- Loading complete entities when a high-traffic dashboard only needs a few fields.
- Testing with small datasets and discovering excessive query counts only after production concurrency increases.
- Treating database performance as an isolated engineering concern instead of involving application owners, DBAs, architects, and business stakeholders.
The common theme is measurement.
Teams that continuously evaluate query behavior against real transaction volumes, audit requirements, and uptime targets tend to perform better than teams that rely solely on a fixed list of ORM best practices.
The goal is not to memorize every EF Core optimization technique.
The goal is to build a development and review process that makes inefficient database behavior difficult to hide.
For applications already in production, this type of continuous performance monitoring, optimization, and maintenance can become an ongoing responsibility. See ConvergeSol’s Application Management Solutions.
Business Risk Analysis: The Cost of Getting N+1 Wrong
An N+1 problem can start as a technical inefficiency and eventually become a financial, operational, or compliance problem.
In one cloud-first retail banking scenario, uncontrolled query amplification pushed monthly database costs 40% over budget. The resulting investigation included an emergency board review and a temporary pause on new feature releases while the issue was addressed.
These considerations are particularly important in financial services, where application performance can affect reporting, compliance workflows, customer operations, and other time-sensitive processes.
In a healthcare scenario, increased data-access activity triggered internal audit controls. The remediation effort consumed approximately three weeks while the team reviewed and revalidated query paths for regulatory signoff.
There is also an important counterpoint.
Trying to eliminate every additional query at any cost can create a different kind of technical debt.
A global freight startup once aggressively optimized its data access around minimizing query counts. The result was a reporting architecture that became harder to adapt as the company's product lines expanded, ultimately requiring significant rework.
The executive lesson is straightforward:
N+1 optimization is not about achieving the lowest possible query count. It is about achieving an appropriate balance between database efficiency, application flexibility, compliance requirements, and business agility.
Three areas deserve particular attention:
- Cost Control: Setting reasonable query-count thresholds can help prevent runaway database usage and improve cloud cost forecasting.
- Agility: Targeted projections can improve performance while keeping application changes manageable, but they require clear requirements and disciplined review.
- Compliance: Regular SQL and data-access reviews can improve audit readiness and reduce the chance of discovering problematic access patterns immediately before a regulatory deadline.
Proactive Strategies: Make Query Performance Part of the Delivery Process
The most resilient organizations do not wait for an N+1 incident to teach them about query performance.
They build prevention into the development lifecycle.
For example, one legal SaaS provider introduced stronger EF Core logging in QA after experiencing two scaling outages. The organization also blocked changes that increased query counts beyond agreed thresholds and introduced pre-release reviews involving both database specialists and business operations.
A transportation SaaS organization went further by exposing API query metrics through executive dashboards, creating a direct connection between technical performance and commercial operations.
These considerations become even more important in multi-tenant SaaS environments, where data volume, tenant growth, and concurrent usage can amplify inefficient database access. See Best Practices for Building Multi-Tenant SaaS Platforms with .NET and Angular.
That distinction matters.
Database query behavior should be treated as a business concern—not something engineering investigates only after a production incident.
Incident reviews can reinforce this culture.
Suppose a reporting tool suddenly generates 100 times the normal database load. The post-incident review should not stop at identifying the faulty query.
The team should also ask:
- What threshold should have caught this earlier?
- Was the feature tested with realistic data?
- Should this endpoint have a query-count limit?
- Does the issue change our cloud-cost forecast?
- Should similar workflows be reviewed?
- What should be added to developer onboarding or architecture guidelines?
When those lessons become part of future requirements and review processes, incidents become opportunities to improve the system rather than isolated firefighting exercises.
Executive Recommendations: Governance and Risk Management Priorities
For leadership teams, N+1 prevention should be treated as part of application governance rather than just a developer-level optimization exercise.
Here are five practical controls worth implementing.
1. Codify Query-Counting Protocols
Require query logging and measurement during QA for data-intensive workflows.
Define acceptable query-count thresholds for important endpoints and connect those thresholds to relevant service-level objectives.
2. Require Pre-Release SQL Review
For EF Core changes affecting core business processes, consider a two-layer review:
- A technical review by a DBA, architect, or senior engineer
- A business-facing review by a process owner, compliance stakeholder, or other appropriate business representative
This ensures that both technical behavior and business impact are considered.
3. Benchmark Against Realistic Data
Testing with a few hundred synthetic records is not enough for systems expected to process thousands or millions of production records.
Performance testing should reflect realistic:
- Data volumes
- Concurrency
- Transaction rates
- Query patterns
- Business workflows
4. Integrate Cost Impact Reporting
Where database usage materially affects cloud spending, query volume and projected database costs should be visible in management and forecasting dashboards.
This helps connect engineering decisions with financial planning.
5. Institutionalize Incident Feedback Loops
A production support escalation, audit anomaly, or unexpected database-cost increase should trigger more than a one-time fix.
Use the incident to update:
- Engineering guidelines
- Query thresholds
- Architecture standards
- Testing practices
- Developer onboarding
- Monitoring requirements
These controls help bridge the gap between architecture intent and what actually happens in production. They also create clearer accountability across engineering, operations, finance, compliance, and business teams.
Case Illustration: What Production Failure Can Teach an Organization
Consider an enterprise HR platform preparing to launch an automated year-end benefits workflow.
The feature worked during testing. After launch, however, an unexpected N+1 pattern caused request times to increase roughly 30x, while support teams were flooded with urgent tickets.
The impact quickly moved beyond application performance. Payroll calculations, customer-service SLAs, and other time-sensitive processes were affected.
The recovery involved a focused query audit, followed by new performance metrics that were made mandatory for future releases.
The resulting governance change was more significant than the immediate technical fix: core platform changes could no longer move forward without documented code and SQL review, and query KPIs were added to leadership go/no-go discussions.
Similar performance and governance considerations are especially important in regulatory workflows. See how ConvergeSol helped modernize SEC 13G/13F compliance and filing management while supporting more efficient, scalable operations.
That is the bigger lesson from N+1 incidents.
The strongest organizations do not simply fix the query.
They improve the process that allowed the query problem to reach production in the first place.
Frequently Asked Questions
What exactly is the N+1 query problem in EF Core?
The N+1 query problem occurs when an application executes one query to retrieve a set of primary entities and then performs an additional query for each related entity. For example, retrieving 100 orders with one query and then executing another query for each order's customer can result in 101 database calls instead of one optimized query or batch operation. In enterprise applications, this can create significant latency and database load as data volume increases.
How does lazy loading contribute to N+1 problems?
Lazy loading retrieves related entities when they are accessed. That sounds convenient, but it can result in additional database queries inside loops or repeated application logic. If an application loads 100 parent records and then accesses a virtual navigation property for each record, it can trigger 100 additional database queries. Without SQL logging or query measurement, those additional calls may not be obvious from the application code.
What are the best ways to measure and diagnose N+1 issues?
Start by enabling detailed EF Core SQL logging and examining the actual queries generated by the application.
Query counters and profiling tools can help measure:
- SQL calls per endpoint
- Database round trips
- Repeated query patterns
- Before-and-after query counts
- Performance changes after using
Include()or projection
Automated tests can also enforce query-count limits before code reaches production.
Is using Include() always the safest fix for N+1 queries?
No. Include() can be effective for eager loading related entities, but using it indiscriminately can result in large queries, unnecessary data retrieval, increased memory consumption, and complex joins. When an API or business workflow only needs a subset of fields, projection with Select() can provide better control over the resulting data shape.
What impact do N+1 queries have in production systems?
N+1 queries can increase application latency, consume database connections, increase infrastructure costs, and put additional pressure on shared database resources. In regulated industries, unusual or excessive data-access patterns may also create additional compliance or audit concerns. The best approach is to identify N+1 problems during development and QA, but production monitoring and post-incident analysis remain important safeguards.
Looking Ahead: From Query Optimization to Continuous Governance
N+1 prevention is becoming less about a single ORM setting and more about continuous visibility into application behavior.
Modern EF Core tooling provides increasingly detailed ways to understand query behavior, while observability and AIOps platforms can help surface unusual database activity in real time.
Database performance is only one part of building production-ready APIs. For another important aspect of ASP.NET Core application readiness, see How to Secure ASP.NET Core APIs in Production.
As applications become more distributed—with microservices, analytics-on-demand, and increasingly dynamic workloads—the distance between a small code change and a significant infrastructure event can become even harder to predict.
That makes automated query tracing, performance thresholds, and evidence-based architecture reviews increasingly important.
The organizations that handle this well will not necessarily be the ones that eliminate every extra database call.
They will be the ones that can answer three questions quickly:
What is the application doing?
What is it costing us?
And do we have the right controls in place to prevent the same problem from happening again?
That is where N+1 moves from being a developer performance issue to an enterprise engineering and governance concern.
Based in the US and evaluating a software development partner? Book a 15-minute call with ConvergeSol to discuss your application performance, architecture, and database optimization needs.
Write your comment
Recent Blogs
Signals vs RxJS in Angular: Where Should Each One Be Used?