Why ASP.NET Core API is Slow: 10 Performance Bottlenecks and How to Fix Them
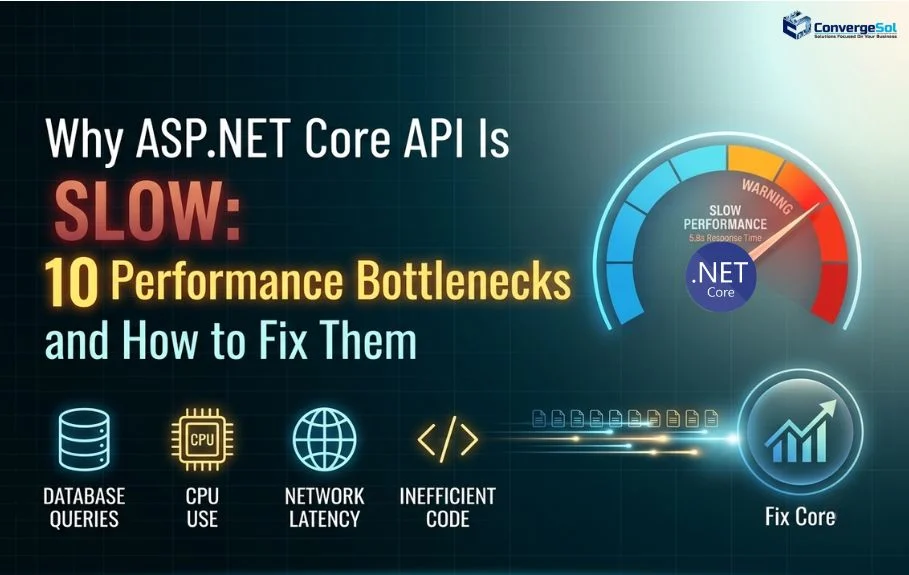
Why is my ASP.NET Core API slow? The most common causes include inefficient database queries, EF Core N+1 queries, blocking code, slow external API calls, large response payloads, poor connection management, excessive logging, inefficient application logic, and too much work in the request pipeline.
An ASP.NET Core API can also appear healthy while still delivering poor response times. CPU and memory usage may be normal, yet users may experience slow requests, timeouts, or inconsistent latency.
The key to ASP.NET Core API performance optimization is finding where the request is actually spending its time. This is especially important when building and scaling custom software products, particularly for technology and SaaS companies where API performance directly affects the user experience.
In this guide, we'll cover 10 common ASP.NET Core API performance bottlenecks, how to identify them, and practical ways to fix them.
Key Takeaways
- Measure before optimizing. Identify where an ASP.NET Core API spends its time by tracking response times, database queries, external API calls, and application execution.
- Database performance is a common bottleneck. Review indexes, execution plans, joins, result sets, and unnecessary database round trips when troubleshooting slow APIs.
- Watch for EF Core N+1 queries. Repeated database calls can increase API latency significantly, especially as data volume and concurrent traffic grow.
- Avoid blocking asynchronous code. Calls such as
.Resultand.Wait()can block threads, contribute to thread pool starvation, and reduce API scalability. - External dependencies can increase API latency. Asynchronous HTTP calls, connection reuse, appropriate timeouts, controlled retries, and distributed tracing can help manage dependency performance.
- Keep API responses efficient. DTOs, pagination, filtering, compression, and smaller JSON payloads can reduce serialization, network, and client-side processing overhead.
- Use caching strategically. Caching can reduce repeated database queries and computation, but data freshness, consistency, security, and cache invalidation should be considered.
- Monitor performance continuously. Track P95/P99 latency, profile application code, and move suitable non-critical work to background processing to maintain predictable API performance.
What Causes ASP.NET Core APIs to Become Slow?
The most common causes of a slow ASP.NET Core API are:
- Inefficient database queries
- EF Core N+1 query problems
- Blocking synchronous code
- Slow external API dependencies
- Large response payloads and serialization
- Poor caching strategies
- Incorrect database or HTTP connection management
- Excessive middleware and logging
- Inefficient application logic
- Lack of production performance profiling
The important point is that ASP.NET Core itself is not always the bottleneck. The delay may come from the database, network, external services, application code, or infrastructure around the API.
1. Inefficient Database Queries
Database performance is one of the first areas to investigate when an ASP.NET Core API becomes slow.
A query that works well with a small development database can become expensive when production tables contain millions of records.
Common database-related causes include:
- Missing indexes
- Inefficient joins
- Full table scans
- Loading unnecessary columns
- Large result sets
- Poorly written LINQ queries
- Repeated database calls
- Slow execution plans
For example, an API may query a customer table using CustomerId, but without an appropriate index, SQL Server may scan a large number of rows for every request. For applications dealing with large or complex datasets, broader data solutions and database optimization can also help address performance issues at the architecture level.
How to Fix Slow Database Queries
Start by measuring the query instead of immediately changing the code.
Check:
- SQL execution plans
- Query duration
- Number of database round trips
- Index usage
- Rows returned
- Generated SQL from EF Core
If the database query is responsible for most of the endpoint's latency, optimizing the ASP.NET Core code around it will have limited impact.
For a practical example, see this guide to identifying and fixing the EF Core N+1 query problem.
2. EF Core N+1 Query Problems
The EF Core N+1 query problem occurs when an application executes one query to retrieve a collection and then sends additional queries for individual items.
For example:
1 query > retrieve 100 customers
100 queries > retrieve details for each customer
----------------------------------------------
101 database queries
The API may work correctly, but the number of database round trips can quickly increase response time. If you're troubleshooting this specific issue, see our guide on the EF Core N+1 query problem for a practical example of how excessive database calls affect API performance.
How Do You Fix an N+1 Query in EF Core?
Depending on the use case, you can reduce N+1 queries by using appropriate eager loading, projections, joins, or explicitly designed queries.
For example, instead of loading entire entities and related data unnecessarily, project only the fields required by the API:
var customers = await db.Customers
.Select(c => new CustomerDto
{
Id = c.Id,
Name = c.Name,
Email = c.Email
})
.ToListAsync();
The important part is not simply replacing one LINQ statement with another. Measure the SQL generated by EF Core and verify the number of database calls.
3. Blocking Code and Thread Pool Starvation
ASP.NET Core is designed to handle asynchronous workloads efficiently, but synchronous calls can still create performance problems.
Code such as:
var result = service.GetDataAsync().Result;
or:
service.GetDataAsync().Wait();
can block threads while the application waits for I/O to complete.
Under low traffic, the problem may be difficult to notice. As concurrency increases, blocked threads can accumulate and lead to ASP.NET Core thread pool starvation.
Symptoms may include:
- Increasing response times
- Requests waiting in queues
- Reduced throughput
- Timeouts
- High thread counts
- CPU usage that doesn't necessarily appear extremely high
How Do You Diagnose Thread Pool Starvation?
Tools such as dotnet-counters, dotnet-trace, and PerfView can help identify thread-pool and runtime behavior.
You should also review application code for:
.Result.Wait()- Blocking locks
- Synchronous I/O
- Blocking third-party libraries
For a deeper troubleshooting process, see this ASP.NET Core thread pool starvation guide.
4. Slow External API Calls
Your ASP.NET Core API may be fast while one of its dependencies is slow.
Modern applications often depend on payment providers, identity platforms, CRMs, shipping services, analytics platforms, and other third-party APIs.
Consider an endpoint that makes three calls:
Customer API 150 ms
Payment API 300 ms
Shipping API 800 ms
---------------------------
Total 1.25 sec
Your application code may execute quickly, but the user still waits more than a second for the response.
How Can You Improve External API Performance?
Use:
- Asynchronous HTTP calls
- IHttpClientFactory
- Connection reuse
- Appropriate timeouts
- Caching where appropriate
- Retry policies with limits
- Circuit breakers for critical dependencies
- Distributed tracing
Be careful with retries. Repeatedly retrying a failing service can increase traffic and make an outage worse.
For applications with multiple integrations, this guide to common SaaS development challenges provides additional context.
5. Large API Responses and JSON Serialization
A slow API isn't always doing too much work. Sometimes it is simply returning too much data.
An endpoint that originally returned 20 KB may gradually grow to hundreds of kilobytes or several megabytes as new fields are added.
Large payloads increase:
- Serialization time
- Network transfer time
- Memory consumption
- Client-side processing
- Mobile application load times
How Can You Reduce ASP.NET Core API Response Size?
Use purpose-built DTOs rather than returning complete database entities.
Also consider:
- Pagination
- Filtering
- Sorting
- Field selection
- Compression where appropriate
- Avoiding unnecessary nested objects
For JSON serialization options and behavior, see the System.Text.Json documentation.
6. Poor Caching Strategy
Caching can significantly improve ASP.NET Core API performance, but it isn't a solution for every endpoint.
Caching is most useful when data is requested frequently and doesn't need to be retrieved or calculated every time.
Depending on the application, you might use:
- IMemoryCache
- Distributed caching
- Response caching
- Redis
- Application-level caching
The challenge is deciding what to cache, how long to cache it, and when to invalidate it.
Can Caching Make an API Slower?
Yes, indirectly.
An inappropriate caching strategy can introduce stale data, cache invalidation problems, additional infrastructure, or unnecessary serialization and network overhead.
For sensitive or frequently changing data, evaluate security and consistency requirements before introducing caching.
7. Database and HTTP Connection Management
Connection management problems can remain hidden until traffic increases.
One common mistake is creating new HttpClient instances repeatedly instead of using IHttpClientFactory.
Poor HTTP connection management can contribute to:
- Socket exhaustion
- Connection delays
- Increased latency
- Intermittent failures
Database connection handling also matters. Use the connection pooling and lifecycle management provided by your database technology and ORM instead of unnecessarily creating and disposing connections manually.
These issues can be especially difficult to reproduce because an application may behave normally during development but fail under production concurrency.
8. Excessive Middleware and Logging
Logging is essential for troubleshooting, but excessive logging can affect API performance.
Detailed logging for every request may increase CPU, memory, serialization, disk, and network usage.
This becomes more noticeable when an API handles thousands of requests per minute.
How Can Logging Affect API Performance?
Every log message can require work to:
- Build the message
- Serialize data
- Write the log
- Send it to a logging platform
- Store and process it
Use appropriate log levels and avoid logging large request and response objects unnecessarily.
The goal isn't to remove logging. It is to make logging useful without putting unnecessary work on the request path.
For additional guidance, see this guide to securing and operating ASP.NET Core APIs in production.
9. Inefficient Application Logic
Not every slow ASP.NET Core API has a database problem.
Application code can also become a bottleneck.
Common examples include:
- Repeated LINQ operations
- Expensive loops
- Processing large collections in memory
- Repeated calculations
- Excessive object allocation
- Unnecessary data transformations
- Performing the same operation multiple times
For example, if an endpoint spends 600 ms processing data in memory and only 50 ms querying the database, optimizing SQL won't solve the main performance problem.
How Do You Find Slow Application Code?
Use profiling and tracing to identify which methods consume the most CPU or execution time.
The goal is to optimize the code that actually contributes to latency—not the code that simply looks inefficient during a review.
10. Doing Too Much Work During an HTTP Request
Some endpoints perform far more work than the client actually needs to wait for.
Imagine an order endpoint that:
- Saves the order
- Generates a PDF
- Sends an email
- Calls an external service
- Updates analytics
- Generates a report
If all of this happens before the API sends its response, the user has to wait for every operation.
How Can You Reduce API Request Processing Time?
Move non-critical work to background processing when appropriate.
Depending on the architecture, this might involve:
- BackgroundService
- Message queues
- Azure Service Bus
- Background job processors
As applications grow, choosing the right infrastructure for background processing, monitoring, and scaling becomes increasingly important. Our cloud solutions for scalable applications can support these broader application and infrastructure requirements.
The goal isn't to move everything into the background. Operations required to complete the request should remain in the request path. Work that can safely happen afterward can often be processed asynchronously.
How to Troubleshoot a Slow ASP.NET Core API
When an API is slow, don't start by rewriting code.
Start by measuring the request.
A practical troubleshooting process looks like this:
1. Measure Response Time
Check actual latency instead of relying only on user complaints.
Look at:
- Average response time
- P50 latency
- P95 latency
- P99 latency
- Throughput
- Timeout rate
P95 and P99 are particularly useful because averages can hide slow outliers.
2. Trace the Request
Break the request into its major components:
Client ? ASP.NET Core ? Application Code ? Database ? External APIs ? Response
This helps identify where the time is actually being spent.
3. Check Database Performance
Look for:
- Slow SQL queries
- N+1 queries
- Missing indexes
- Full table scans
- Large result sets
- Inefficient joins
4. Check Thread Usage
Look for blocking calls and signs of thread pool starvation.
Review .Result, .Wait(), synchronous I/O, locks, and third-party libraries.
5. Check Request and Response Size
Large payloads can add significant serialization and network overhead.
Measure the actual payload size instead of assuming it is insignificant.
6. Profile Before and After Changes
Make one meaningful change at a time.
Then measure again.
This makes it much easier to determine whether the change actually improved performance.
Modern .NET Capabilities for API Performance
Modern .NET provides several capabilities that can support API performance, scalability, and observability.
- Native AOT: Can reduce application startup time and memory usage for suitable applications, particularly workloads where fast startup is important.
- OpenTelemetry: Provides standardized observability for collecting traces, metrics, and other telemetry across applications and distributed services. Learn how our AI Solutions and automated diagnostics can help integrate smart telemetry into your observability stack.
- HTTP/3: Uses QUIC to provide a modern transport for HTTP communication and can offer benefits for certain network conditions and application scenarios.
These technologies are not automatic fixes for a slow API. They are most useful when applied to a specific requirement identified through profiling, monitoring, and performance testing.
ASP.NET Core Performance Optimization: What Should You Prioritize?
There is no single optimization that works for every API.
A useful priority order is:
| Area | What to Check |
|---|---|
| Database | Queries, indexes, execution plans, and N+1 queries |
| Application | CPU-heavy code, memory allocations, loops, and data processing |
| Async | Blocking calls, synchronous I/O, and thread pool usage |
| External APIs | Dependency latency, timeouts, failures, and retry behavior |
| HTTP | Connection reuse, HTTP client management, and timeouts |
| Payloads | Response size, JSON serialization, pagination, and compression |
| Caching | Cache hit rate, invalidation, data freshness, and consistency |
| Logging | Log volume, serialization overhead, and request-path impact |
| Background Work | Tasks that can run asynchronously without blocking requests |
| Monitoring | P95/P99 latency, tracing, dependency performance, and error rates |
These performance considerations often come together in real-world application development, where APIs, databases, cloud infrastructure, and reporting capabilities need to work reliably at scale. See our Interactive Dashboard case study to explore how ConvergeSol built a scalable platform using .NET Core, SQL Server, Angular, Azure, AWS, and Web APIs.
The important thing is to prioritize based on measurements.
If the database consumes 80% of the request time, start there.
If an external API consumes 70%, database optimization isn't going to solve the immediate problem.
Frequently Asked Questions
Why is my ASP.NET Core API slow?
A slow ASP.NET Core API is commonly caused by inefficient database queries, EF Core N+1 queries, blocking code, slow external services, large response payloads, excessive logging, poor connection management, or inefficient application logic.
The first step is to measure the endpoint and identify where the request spends its time.
How do I check why my ASP.NET Core API is slow?
Use application monitoring, distributed tracing, database profiling, and .NET diagnostic tools to break down request latency.
Tools such as Application Insights, dotnet-counters, dotnet-trace, and database execution plans can help identify whether the bottleneck is in application code, the database, or an external dependency.
What is the most common cause of slow ASP.NET Core APIs?
There isn't one universal cause. Database queries, blocking operations, external API calls, and inefficient application code are all common sources of latency.
The actual bottleneck should be confirmed through profiling and measurements rather than assumed.
How do I fix an EF Core N+1 query problem?
First identify the repeated database queries using SQL logging or profiling. Then consider projections, eager loading, joins, or other query patterns appropriate for your data model.
The goal is to reduce unnecessary database round trips while retrieving only the data the endpoint actually needs. For a practical example, see our guide on the EF Core N+1 query problem.
Can excessive logging slow down an ASP.NET Core API?
Yes. High-volume logging can consume CPU, memory, I/O, and network resources.
Use appropriate log levels and avoid serializing large objects for every request.
Does async/await improve ASP.NET Core API performance?
Async/await can improve scalability for I/O-bound operations because threads aren't unnecessarily blocked while waiting for databases, HTTP services, or other asynchronous operations.
However, simply adding async doesn't automatically make code faster. The underlying operation and application architecture still matter.
Should I use caching to speed up my ASP.NET Core API?
Caching can reduce database queries and repeated computation when the same data is requested frequently.
However, you should consider data freshness, invalidation, consistency, security, and cache-hit rates before introducing it.
How can I reduce ASP.NET Core API response time?
Start by measuring where latency occurs. Then address the largest contributor—such as slow SQL queries, external API calls, blocking code, oversized payloads, or expensive application logic.
Optimizing the actual bottleneck usually produces a much larger improvement than making small changes throughout the application.
Final Thoughts
When an ASP.NET Core API becomes slow, the answer isn't always a framework setting or a faster server.
The bottleneck could be hiding in a database query, an external API, a blocking call, an oversized JSON response, excessive logging, or application code doing unnecessary work.
The most reliable approach is straightforward:
Measure > Trace > Find the bottleneck > Fix it > Measure again.
Don't optimize based on assumptions.
If the database is responsible for most of the latency, fix the database problem. If an external dependency is slow, investigate that dependency. If threads are being blocked, fix the request pipeline.
Good ASP.NET Core performance optimization starts with evidence. Once you know where the time is going, the path to a faster API becomes much clearer.
Building or modernizing software for your US-based business? Contact Us today to discuss your project and technology needs.
Write your comment
Recent Blogs